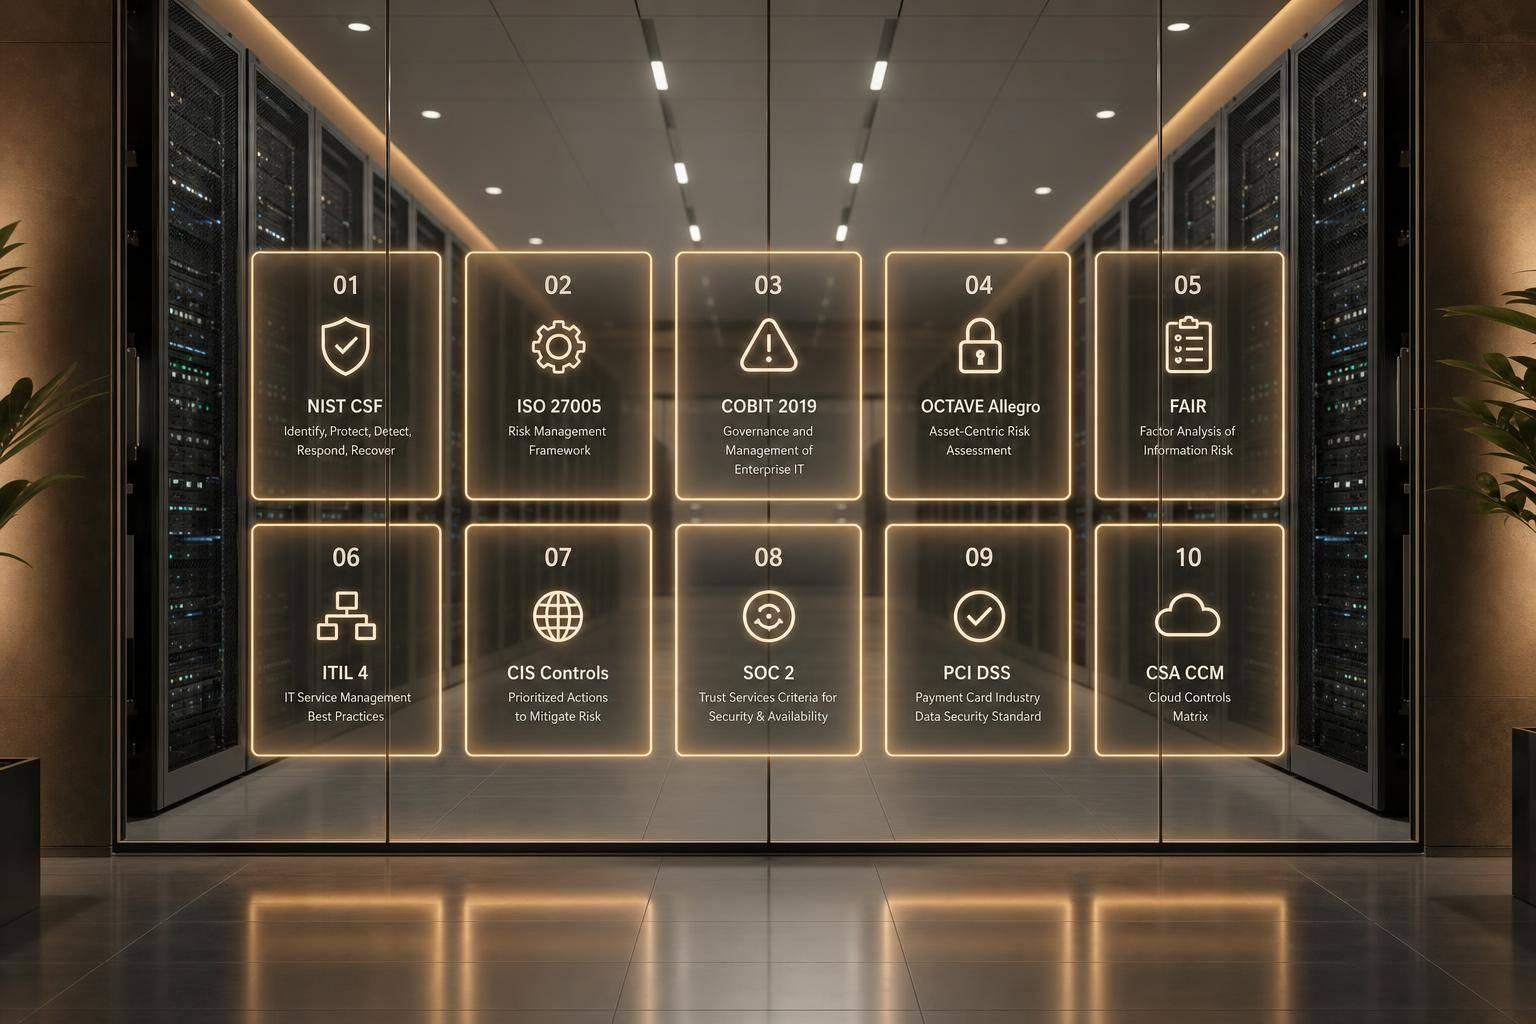
10 Frameworks for Evaluating IT Infrastructure Risks
If I had to boil this down to one point, it’s this: no single framework is enough for IT infrastructure risk. If you want fewer outages and lower loss, I’d start with NIST RMF for control and ownership, use BIA to put downtime into business terms, add FMEA and SRE error budgets for day-to-day service risk, and use DR plus resilience reviews to check whether recovery will work when things fail.
Here’s the short version:
- NIST RMF helps me set governance, system ownership, and control checks
- NIST CSF helps me line up cyber risk decisions across the business
- ISO 27001/27002 gives me a control set tied to availability, backups, logging, and recovery
- ITIL helps me deal with incidents, changes, and repeat outages
- BIA tells me what downtime costs and which services matter most
- FMEA shows me how parts can fail and which failure modes need work first
- ALE turns risk into U.S. dollar estimates, which helps with budget calls
- SRE error budgets set hard limits for downtime and release risk
- DR maturity assessment checks whether recovery targets can be met
- Infrastructure resilience assessment checks whether the design can survive zone, region, or site failure
A few numbers make the point fast:
- Average downtime cost in 2025 reached $14,056 per minute
- Only 50% of organizations meet RTOs during actual disruptions
- 74% of enterprises sit in the lowest two DR maturity horizons
- A 99.9% SLO allows only 43.2 minutes of downtime in a 30-day window
So if you’re asking, “Which framework should I use?” my answer is simple: pick the one that matches the risk decision in front of you. Use governance frameworks for ownership and compliance, service frameworks for incident and change risk, and recovery frameworks for failover and restore proof.
::: @figure 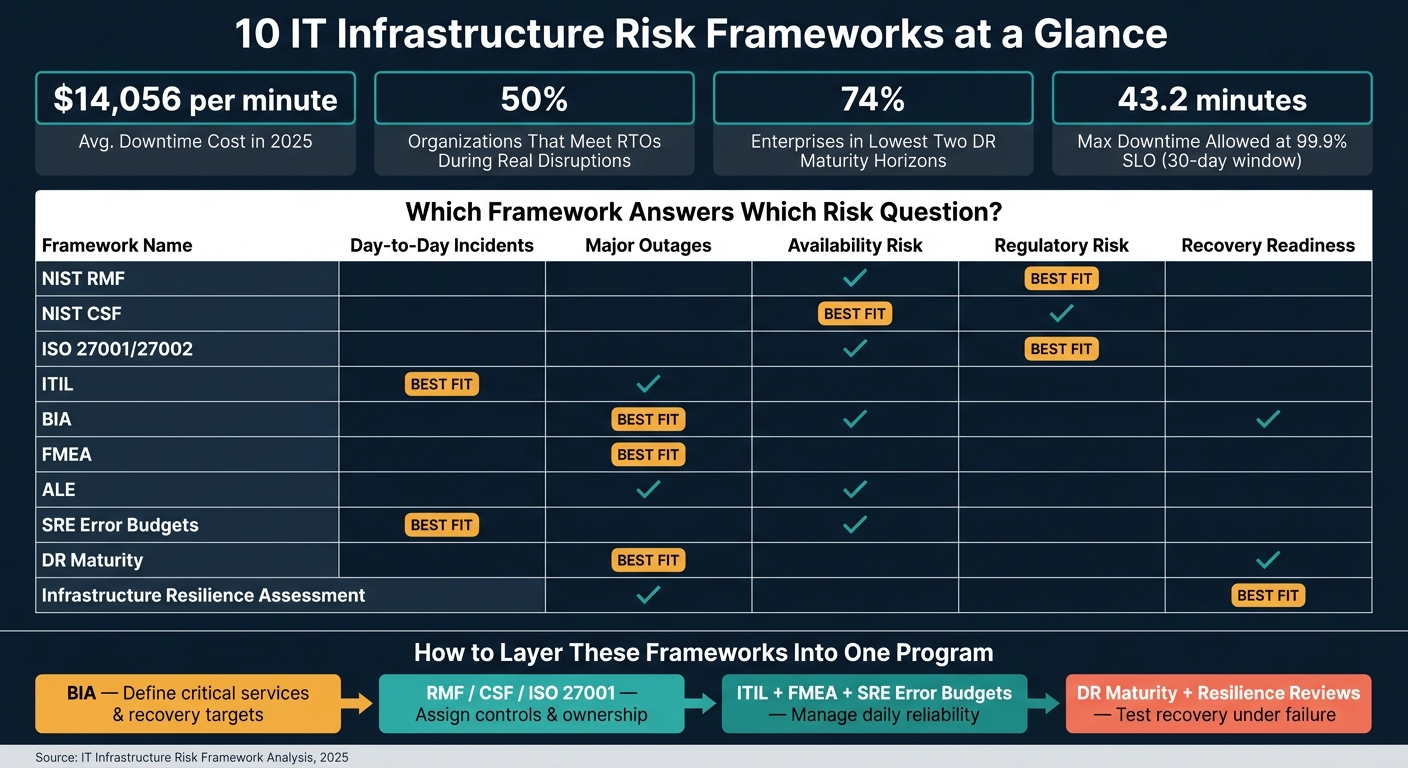 {10 IT Infrastructure Risk Frameworks: Quick Comparison Guide}
:::
{10 IT Infrastructure Risk Frameworks: Quick Comparison Guide}
:::
Introduction to Risk Management Frameworks and Standards: A Beginner’s Guide | NxtChair
::: @iframe https://www.youtube.com/embed/Z3jxmAwpx-I :::
sbb-itb-127d2b5
Quick Comparison
| Framework | Best use | What it helps answer |
|---|---|---|
| NIST RMF | Control and governance | Who owns the risk, and which controls should be checked? |
| NIST CSF | Enterprise cyber risk view | Which cyber gaps are most likely to hurt uptime? |
| ISO 27001/27002 | Control mapping | Which control gaps affect backups, logging, redundancy, and recovery? |
| ITIL | Service support | Which incidents, problems, and changes are driving downtime? |
| BIA | Business impact | What does downtime cost, and how fast must recovery happen? |
| FMEA | Failure ranking | Which component or process failures should I fix first? |
| ALE | Cost model | Is the control worth the money? |
| SRE Error Budgets | Availability guardrails | Is reliability good enough to keep shipping changes? |
| DR Maturity | Recovery review | Can the team restore service inside target windows? |
| Resilience Assessment | Architecture review | Can the system stay up through site, zone, or region failure? |
My takeaway: start with the business impact, assign ownership, measure failure paths, and test recovery with proof - not just plans on paper.
1. NIST Risk Management Framework (RMF)
The NIST RMF is a 7-step lifecycle process: Prepare, Categorize, Select, Implement, Assess, Authorize, and Monitor. Its job is to build risk decisions into the SDLC instead of treating them as a last-minute checkbox [5]. It can be used across legacy systems, cloud environments, IoT, and control systems [5].
Downtime Impact Modeling
Start with Categorize. This is where you rank systems based on outage impact. A simple way to think about it: if a service went down for 24 hours, which ones would hurt operations the most? From there, map the dependencies behind those services so you can see what keeps them running and where the weak spots sit [5][9].
Reliability and Resilience Coverage
The middle of RMF does the heavy lifting. Select, Implement, and Assess are used to map and verify controls from NIST SP 800-53, while Monitor tracks how well those controls keep working as infrastructure changes over time [5][6][7].
Decision Support for Mitigation Prioritization
Authorize is where technical findings turn into a business decision. Leaders review residual risk and decide what level of downtime the organization can live with. In practice, this is a good point to compare the cost of a control against the cost of expected downtime [5][8].
Data and Operational Maturity Required
RMF works best when the groundwork is already in place. If your asset inventory is incomplete or system ownership is fuzzy, the process can bog down fast. Before you begin, you should already have:
- Asset Management: Hardware/software inventory, cloud subscriptions, API/integration maps [9]
- Business Context: Data flow diagrams, system dependency maps, Business Impact Analysis [9]
- Governance: Risk appetite statements, named owners, security and privacy plans [9]
- Operational Data: Vulnerability scan results, configuration baselines, incident history [9]
Once RMF sets governance and ownership, it often makes sense to shift into a lighter framework for organization-wide risk visibility.
2. NIST Cybersecurity Framework (CSF)
Once RMF sets system-level controls, CSF gives the organization a shared way to make cybersecurity risk decisions. Released in February 2024, CSF 2.0 groups outcomes into six functions: Govern, Identify, Protect, Detect, Respond, and Recover [11]. The new Govern function puts cybersecurity governance and accountability closer to enterprise risk decisions [11]. That matters when teams need to sort out which services MUST stay up and which gaps are most likely to lead to outages.
Downtime Impact Modeling
The Identify function calls for an inventory of hardware, software, and services, along with the business processes that need to stay online, such as payment processing or customer data access [10]. In plain terms, you can’t protect what you haven’t mapped. The Recover function then sets expectations for how fast services need to come back through RTOs and how much data loss is acceptable through RPOs [10][14].
Reliability and Resilience Coverage
CSF 2.0’s Protect function includes Technology Infrastructure Resilience (PR.IR), a category aimed at architectures that keep critical services available during disruption [12]. Paired with Detect for continuous monitoring, Respond for incident mitigation, and Recover, the framework covers the full path from prevention to restoration.
Decision Support for Mitigation Prioritization
CSF Profiles help organizations decide what to fix first. A Current Profile shows existing outcomes. A Target Profile shows the outcomes needed based on business requirements and risk tolerance. The gap between them becomes a prioritized mitigation roadmap [13][14].
Intel used this approach in a pilot project, building category-level heatmaps to rank issues and focus downtime-reduction work where it would matter most [13].
Data and Operational Maturity Required
CSF Implementation Tiers run from Partial to Adaptive [11][13]. Higher tiers call for documented risk registers, clear ownership, and KRIs with thresholds. That gives teams a firmer base for faster, clearer downtime decisions.
For example:
- Track mean time to patch critical vulnerabilities each week
- Set amber above 7 days
- Set red above 30 days [14]
3. ISO 27001/27002 Information Security Management
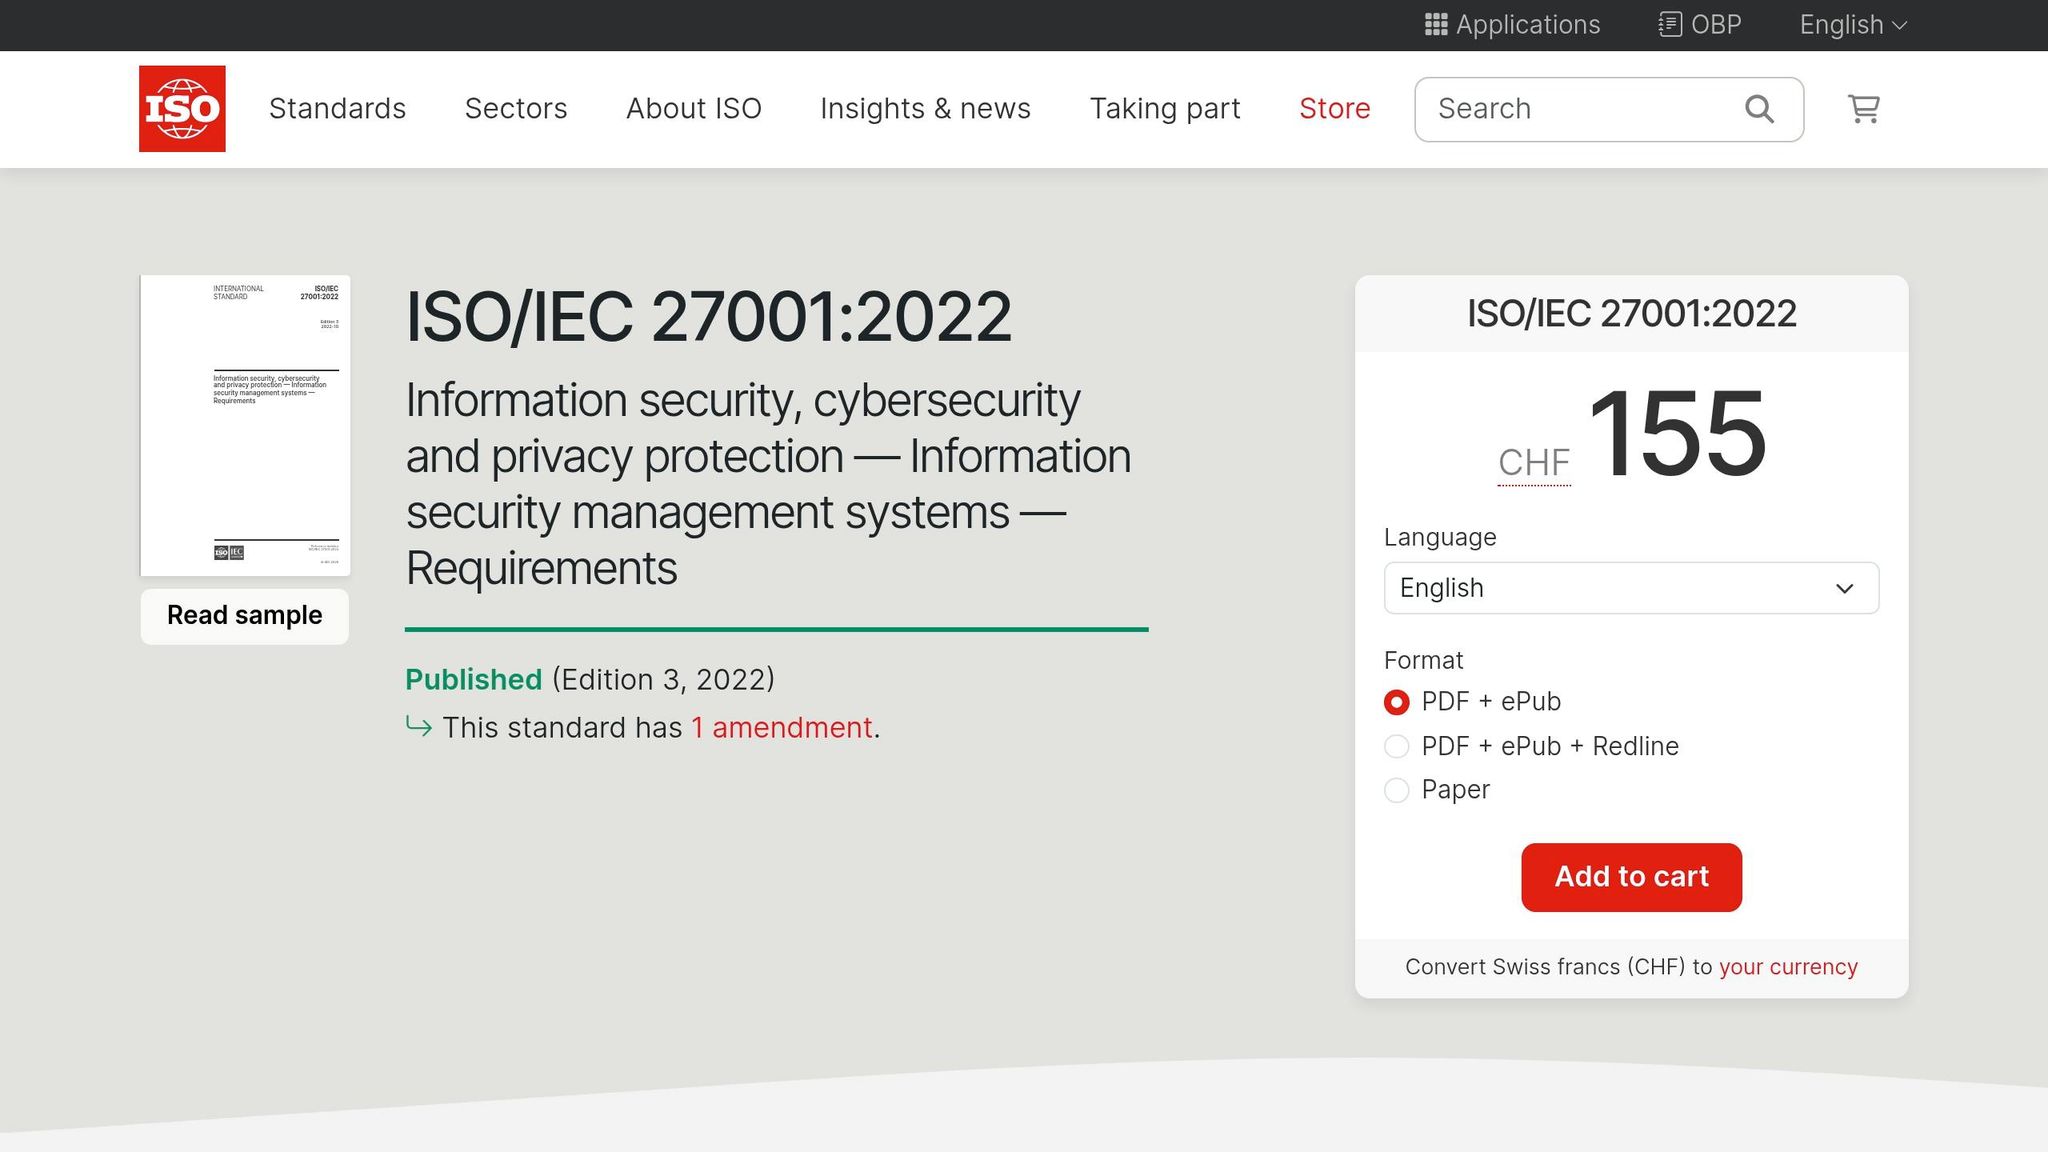
ISO 27001 is a risk-based management system built to cut infrastructure risk. ISO 27002:2022 trims the control set from 114 to 93 controls across four themes. For infrastructure teams, the Technological theme matters most. Its 34 controls tie most directly to uptime, backups, logging, redundancy, and capacity.
Use ISO when you need a control set that connects outage risk to backups, redundancy, logging, and recovery.
Downtime Impact Modeling
ISO 27001's Clause 6.1.2 calls for a formal risk assessment built around the CIA triad - Confidentiality, Integrity, and Availability [15][17]. Of those three, Availability has the clearest link to outages and service slowdowns.
The framework uses a 1–5 impact scale. Pair that with a 5×5 likelihood-impact matrix, and infrastructure teams get a practical way to rank risk, focus resilience spending, and defend redundancy budgets [16][18]. It gives teams a simple answer to a common problem: which risk should we fix first?
Reliability and Resilience Coverage
The controls below map straight to uptime and restore readiness. In plain terms, these are the controls that matter most for backup integrity, redundancy, logging, change control, and tested recovery.
| Reliability Category | ISO 27001:2022 Control(s) | Key Requirement for Infrastructure |
|---|---|---|
| Data Redundancy | A.8.13 | Backup policy and mandatory restore testing |
| System Stability | A.8.32 | Formal change management procedures |
| Operational Visibility | A.8.15, A.8.16 | Centralized logging and active monitoring |
| Service Continuity | A.5.29, A.5.30 | ICT readiness and tested recovery plans |
Decision Support for Mitigation Prioritization
ISO 27001 also requires a Risk Treatment Plan (RTP). This document spells out the actions to take, who owns them, and when they need to be done [18][20].
From there, teams can choose from the standard risk treatment paths:
- Mitigate
- Transfer
- Avoid
- Accept
If a risk sits above the organization's acceptance criteria, it should be treated with Annex A controls [18][19].
Data and Operational Maturity Required
Using ISO 27001 well takes more than a checklist. It depends on five core documents:
- Risk Assessment Methodology
- Asset Register
- Risk Register
- Risk Treatment Plan
- Statement of Applicability (SoA)
The Statement of Applicability (SoA) plays a big role here. Every control marked "applicable" should link back to a specific risk in the register [18][20].
This control baseline sets up the operational practices covered in ITIL.
4. ITIL Service Management Practices
ITIL helps teams manage infrastructure risk through incidents, problems, changes, and service targets. It ties day-to-day IT work to business-critical service levels, including uptime goals and SLA performance [22]. That link matters. When a service goes down, the issue stops being “just IT” and becomes a business problem that needs fast action.
Downtime Impact Modeling
ITIL often starts with a BIA to rank services by downtime cost and recovery urgency. Once teams know which services matter most, the BIA can put a dollar figure on the impact of losing them.
Reliability and Resilience Coverage
In ITIL, Availability Management focuses on reliability, maintainability, and serviceability. Teams often track metrics like these:
| Metric | What It Measures |
|---|---|
| MTBF (Mean Time Between Failures) | How long a service runs without interruption [21] |
| MTRS (Mean Time to Restore Service) | Time from incident detection to service restoration [25] |
ITIL 4 puts more weight on MTRS than MTTR because customers care about when service is back, not when a part is repaired [25].
The Configuration Management Database (CMDB) shows how hardware, software, and business services connect, which helps teams spot outage paths caused by dependencies [23]. Think of it like a route map: if one stop fails, you can see which other stops may get hit next. More organizations now use automated tools to keep those dependency maps up to date at all times [24].
Decision Support for Mitigation Prioritization
Problem Management cuts repeat downtime by finding the root causes behind recurring incidents and recording both workarounds and permanent fixes [23]. Change Enablement helps stop new risk from slipping in during infrastructure updates by bringing service continuity stakeholders into Change Advisory Board (CAB) reviews before changes go live [23].
One of the most common weak spots is unclear ownership. A team may own the risk, but no one person owns the fix. That’s where things stall. ITIL works far better when each service, risk, and recovery plan has a named owner.
Data and Operational Maturity Required
ITIL risk insight depends on the quality of the data behind it. A CMDB that isn’t kept up creates blind spots. Stronger setups rely on automated workflows and real-time dashboards [2].
Next, BIA puts dollar values and recovery urgency behind those service priorities.
5. Business Impact Analysis (BIA)
BIA asks a simpler question: what does downtime cost the business? That shift matters. It turns BIA into a direct input for recovery priority.
BIA starts by listing each critical business process. From there, it maps those processes to the dependencies they rely on and the single points of failure (SPOFs) behind them - resources with no backup path whose loss can trigger service failure [27][28][29]. That business-first view sets up the next step: figuring out which failures hit hardest and how fast the damage spreads.
Downtime Impact Modeling
BIA looks at the impact of disruption across four areas: financial, reputational, legal/regulatory, and operational [26][27]. In 2025, the average downtime cost hit $14,056 per minute across all organizations [31].
Three metrics sit at the center of every BIA output:
| Metric | Definition | Owner |
|---|---|---|
| Maximum Tolerable Downtime (MTD) | Longest acceptable outage | Business Owner [27] |
| Recovery Time Objective (RTO) | Target time to restore service | IT/Technical Team [26] |
| Recovery Point Objective (RPO) | Maximum acceptable data loss | Business/Data Owner [26] |
One rule is non-negotiable: RTO must always be shorter than MTD. A simple way to think about it is this: if MTD marks the cliff, RTO needs to leave room to stop before the edge. In many teams, RTO is set at about 50–75% of that limit so there’s still time for data reprocessing and full operational restoration [27][30].
Decision Support for Mitigation Prioritization
BIA turns recovery targets into spending choices that leaders can defend. A system with a 5-minute RTO can justify high-availability failover clustering. A system with a 24-hour RTO may only need standard backups [26][30]. That keeps resilience spending tied to business need instead of guesswork.
Dependency mapping also exposes a blind spot that shows up all the time: business functions that look separate on the surface may still depend on the same database or the same third-party vendor. Put money into resilience at that shared layer, and you may protect several business lines at once [30][29].
Data and Operational Maturity Required
A BIA is only as strong as the inputs behind it. It needs a full inventory of hardware, software, cloud services, and vendors, along with executive support to get cross-functional teams working together [9][29]. Without that, gaps show up fast.
There’s another common issue. Process owners often ask for very tight RTOs to show that their system matters. Once those numbers are reviewed with their managers, the targets usually shift to levels that make more sense and cost less [30].
Next comes FMEA, which breaks those dependencies into specific failure modes and ranks their severity.
6. Failure Mode and Effects Analysis (FMEA)
Building on BIA's dependency maps, FMEA goes one level deeper: down to the component level. It shows where infrastructure can break, what that break does to the business, and which risks need attention first.
The idea is simple. Break a complex system into individual parts, then ask how each one might fail.
Start by listing infrastructure components such as servers, APIs, identity providers, storage, and cloud regions. Then define each component's failure modes, meaning the specific ways that part can fail. Common examples include database latency, a regional outage, API gateway misconfiguration, and identity provider outages that block user sign-in [32][35].
Score each failure across three dimensions:
| Dimension | What It Measures | Example |
|---|---|---|
| Severity (S) | Business impact of the failure | A database outage stopping all customer transactions |
| Occurrence (O) | How often the failure is expected to happen | A deployment script failing once every three months |
| Detection (D) | Whether monitoring, logging, or tests catch the failure before users are affected | Alerts that trigger before an SSL certificate expires |
Calculate RPN as S × O × D. In standard FMEA, an RPN above 125 is often treated as urgent [34]. The AIAG-VDA Action Priority method sorts risks as High, Medium, or Low, and it automatically marks any item with Severity 9 or 10 as High [33]. That difference matters: RPN gives equal weight to all three dimensions, while AP puts severity first [33].
Reliability and Resilience Coverage
Use DFMEA to spot architecture-level weak points, such as a single point of failure in a core switch. Use PFMEA to find gaps in operations like deployment, backups, patching, and incident response [32][36].
Decision Support for Mitigation Prioritization
Looking at results by category, such as data integrity, access management, or network resilience, helps teams spot patterns instead of treating each issue as a one-off defect [32]. That's often where the bigger story shows up.
The two most common mitigation paths are:
- Resiliency, which adds redundancy to remove a single point of failure
- Graceful degradation, which keeps the system partly working when a non-critical component fails - for example, when an e-commerce recommendation engine goes down but checkout still works [35]
For each high-priority item, assign a clear owner, a deadline, and a success metric [32]. Otherwise, FMEA can turn into a nice spreadsheet that nobody acts on.
7. Annualized Loss Expectancy (ALE) Quantitative Risk Analysis
FMEA helps you rank failure modes. ALE puts a dollar figure on what those failures could cost each year.
That shift matters. Once infrastructure risk is translated into annual cost, it gets much easier to compare one risk against another and explain why a control is worth the money. The formula is simple: ALE = SLE × ARO [37][38][4].
Single Loss Expectancy (SLE) is the cost of one incident. That can include lost revenue, response costs, downtime, fines, and reputational harm. Annual Rate of Occurrence (ARO) is how often you expect that event to happen in a year.
Downtime Impact Modeling
For outages, a practical way to estimate SLE is:
- Downtime duration × hourly business impact
Use MTTR to estimate how long an outage usually lasts. Then apply the hourly business impact to that duration. The result gives you a dollar estimate you can use in mitigation decisions, instead of relying on rough guesses.
Decision Support for Mitigation Prioritization
ALE makes mitigation choices much easier to discuss because it ties them to cost.
Say a $50,000 failover upgrade cuts annual exposure from $200,000 to $20,000. That case is much easier to defend [4]. In plain terms, a control is worth pursuing when the drop in ALE is greater than what the control costs [37].
You can also use the remaining ALE to compare response options like Mitigate, Transfer, Accept, and Avoid. That gives teams a clearer way to sort tradeoffs, especially when budget is tight.
Data and Operational Maturity Required
ALE is only as good as the data behind it. If the inputs are shaky, the output will be too.
Reliable calculations need a solid asset inventory, data classification for systems that handle PII, PCI, or HIPAA data, and incident history to estimate both ARO and SLE [38][1]. In practice, that means organizations need structured asset tracking, incident records, and automated evidence collection to produce ALE figures people can trust [4][2].
Next, SRE error budgets turn this cost view into service-level guardrails.
8. Site Reliability Engineering (SRE) Error Budgets
SRE error budgets set a hard limit on how much downtime or how many failed requests a service can absorb in a rolling 28- or 30-day window. The math is simple: take the gap between 100% and the SLO, and that gap becomes the budget [39][41][42].
That turns availability risk into something much more concrete: a release decision. If the budget is in good shape, teams can ship with confidence. If it's running low, shipping starts to look a lot riskier.
That also makes the budget easy to convert into downtime minutes:
| SLO Target | 30-Day Downtime Allowance |
|---|---|
| 99% | 7.2 hours |
| 99.5% | 3.6 hours |
| 99.9% | 43.2 minutes |
| 99.99% | 4.32 minutes |
| 99.999% | 25.9 seconds |
There’s a catch, though. In a real service chain, your ceiling can drop fast. Dependencies stack on top of each other, and each one adds risk. Two serial 99.9% services, for example, max out at 99.8% availability [39][43].
Reliability and Resilience Coverage
Burn rate shows how fast a team is spending that budget. A burn rate of 1.0 means the budget will last exactly through the full 30-day window. A burn rate of 14.4x means the entire 30-day budget disappears in about 50 hours [39][40][43].
That kind of signal matters because it turns reliability from a vague concern into a live operating number. Some teams also use composite service metrics so the trade-off between feature delivery and reliability is easier to see [39][43].
Decision Support for Mitigation Prioritization
The main control here is an error budget policy. When the budget is healthy, teams deploy as usual. When it starts shrinking, reviews get tighter. When the budget is spent, releases stop and the team runs a postmortem [39][40][41].
"The freeze is a tool, not a punishment... this policy gives teams permission to focus exclusively on reliability when data indicates that reliability is more important than other product features." - Site Reliability Workbook [39]
This is what makes error budgets useful in practice. They don't just measure reliability; they shape behavior.
Data and Operational Maturity Required
Without user-facing SLIs, downtime risk stays too abstract to manage well. Teams need to track measures that reflect what users actually feel, such as:
- Request success rate
- Latency
Internal signals like CPU or RAM can still help with diagnosis, but they should not stand in for user-facing SLIs. Teams should also use rolling 28- or 30-day windows and count vendor outages against the budget, since status pages often trail the incident itself [40][41][43][44].
Next, disaster recovery maturity assessments test whether your organization can meet those targets when systems fail.
9. Disaster Recovery Maturity Assessment
After SRE sets how much downtime a service can take, DR maturity assessment checks whether the organization can recover inside that window. In plain English, it measures recovery readiness when systems break, not just whether a plan exists in a document somewhere. That makes it a practical check on whether recovery targets are realistic.
The assessment looks at four areas: people (skills and mindset), process (repeatability and documentation), technology (tools and infrastructure), and business alignment (fit with business resilience goals) [45].
The gap is still big. IDC data shows that 74% of enterprises sit in the lowest two maturity horizons, and only 50% of organizations meet RTOs during actual disruptions [48].
Downtime Impact Modeling
Many assessments use downtime modeling to estimate the financial and reputational cost of outages. That helps teams focus on the services that must keep running [46]. A good place to start is with the systems that already fail restore tests, failover drills, or runbook checks.
| Maturity Level | Primary Focus | Key Characteristics |
|---|---|---|
| Level 1: Get Resilient | Foundation | Basic redundancy, inventory of systems, and initial failure playbooks [46] |
| Level 2: Self-Preservation | Stability | Asynchronous communication, health probes, and structured logging [46] |
| Level 3: Recovery Readiness | Preparation | Health modeling, failure mode analysis, and measurable recovery objectives [46] |
| Level 4: Maintain Stability | Operations | Managing data growth, operational complexity, and change management [46] |
| Level 5: Stay Resilient | Adaptability | Architectural evolution to withstand new and unforeseen risks [46] |
Decision Support for Mitigation Prioritization
A DR maturity assessment also gives leadership a clearer way to choose where money and time should go first. The key is to rank fixes by business impact - revenue, legal exposure, or customer trust - not just by technical severity [9]. A slow database might look like a medium technical issue, but if it affects checkout or payroll, it becomes a major business risk [9].
One common finding shows up again and again: organizations have backups, but they have never tested a restore [47]. That’s like owning a spare tire and never checking whether it fits the car. Regular restoration tests, plus written results, are one of the fastest ways to close the gap between having a plan and being able to carry it out under stress [47].
Data and Operational Maturity Required
High-maturity programs tend to share the same core habits: backups, drills, and executive ownership [48]. IDC data shows that assigning executive ownership increases the chance of reaching advanced maturity by nearly 50% [48]. One large healthcare provider reportedly cut recovery times from hours to minutes through quarterly exercises, saving an estimated $5 million per outage [48].
Tested runbooks, clear ownership, and measured recovery performance show whether redundancy can stand up when failure hits. If recovery does not work in practice, the next issue is simple: whether the infrastructure has enough redundancy to survive the failure in the first place.
10. Infrastructure Resilience and Redundancy Assessment
After BIA sets recovery targets and DR maturity reviews check readiness, this assessment answers the practical question: can the architecture meet those targets in the real world? It looks at whether critical dependencies can take a hit without causing a customer-facing outage. Put simply, the job is to spot single points of failure before they turn into downtime.
Reliability and Resilience Coverage
The assessment reviews redundancy across three layers: Local (inside one Availability Zone), Regional (across multiple zones), and Global (across separate geographies) [50]. The right layer depends on the service's recovery target, and it isn't enough to assume failover will work. You need to test whether it can switch over cleanly under pressure.
For high-protection disaster recovery, secondary sites usually need to be at least 250 miles (400 kilometers) apart to lower the chance that the same regional natural disaster hits both sites [50]. Data resiliency is checked on its own because distance changes what is possible. Synchronous mirroring keeps data in sync, but network latency limits how far apart systems can be. Asynchronous replication, snapshots, and logical replication can extend coverage across larger geographic areas [50].
Downtime Impact Modeling
Once failure domains are mapped, the next step is to put a dollar figure on failure. That means measuring repair costs, monitoring costs, lost revenue, churn, penalties, and reputation damage [49][50]. If a service goes down, the bill usually comes from more than one direction.
The DR strategy you pick has a direct effect on that exposure:
| DR Strategy | RPO / RTO | Cost Level | Key Characteristic |
|---|---|---|---|
| Active/Active | Near zero | Highest | Both regions serve live traffic simultaneously [50] |
| Active/Standby | Minutes | High | Backup site replicates data and only takes traffic on failure [50] |
| Active/Passive | Hours | Lower | Backup site is idle; recovery requires restoration and activation [50] |
| Backup & Restore | Variable | Lowest | Point-in-time snapshots; highest risk of data loss [50] |
Decision Support for Mitigation Prioritization
Not every gap gets fixed in one pass. That's normal. A risk matrix helps sort issues by comparing mitigation cost with expected loss, so teams can focus first on the gaps where the math is hard to ignore [3].
Modern assessments should also cover cyber resiliency. This looks at whether the business can recover data and keep operating during a ransomware event or another malicious incident [50]. A system may survive hardware failure and still fall apart during an attack, so both angles matter.
Data and Operational Maturity Required
High-maturity programs do not rely on architecture diagrams alone. They back claims with proof: documented RTO and RPO targets for every critical application, backup restoration logs, and results from chaos engineering or failure testing in production-like environments [50].
Infrastructure as Code (IaC) is another strong signal of maturity because it supports automated, repeatable recovery processes [50]. Without test evidence, redundancy is still just a plan on paper.
These findings feed directly into the framework comparison that follows.
Quick Comparison of All 10 Frameworks
Once you’ve looked at each framework on its own, the next step is simpler: match the framework to the decision you need to make.
This isn’t about picking the “best” framework. It’s about picking the one that answers the risk question in front of you right now.
| Approach | Data Needs | Assessment Effort | Downtime Precision | Common Use Cases |
|---|---|---|---|---|
| Qualitative (e.g., NIST RMF, NIST CSF, ISO 27001/27002) | Control status, asset criticality, expert opinion | Moderate | Low - focuses on High/Medium/Low impact | Compliance, initial risk identification, governance |
| Hybrid (e.g., BIA, FMEA) | Numerical scales, financial impact estimates | Moderate–High | Medium - uses scoring or weighted impact to prioritize failures | Failure prioritization, recovery planning |
| Quantitative (e.g., ALE, SRE Error Budgets) | MTBF/MTTR, financial loss per hour, event frequency | High | High - estimates exact availability and financial loss | Budget justification, ROI analysis, SRE operations |
The matrix below shows where each framework fits best. One pattern stands out fast: compliance-heavy frameworks often miss operational failure patterns.
| Framework | Day-to-Day Incidents | Major Outages | Availability Risk | Regulatory Risk | Recovery Readiness |
|---|---|---|---|---|---|
| 1. NIST RMF | ✓ | Best fit | |||
| 2. NIST CSF | Best fit | ✓ | |||
| 3. ISO 27001/27002 | ✓ | Best fit | |||
| 4. ITIL | Best fit | ✓ | |||
| 5. BIA | Best fit | ✓ | ✓ | ||
| 6. FMEA | Best fit | ||||
| 7. ALE | ✓ | ✓ | |||
| 8. SRE Error Budgets | Best fit | ✓ | |||
| 9. DR Maturity | Best fit | ✓ | |||
| 10. Infrastructure Resilience Assessment | ✓ | Best fit |
Use this map to bring governance, operations, and resilience frameworks into one program. The key is to combine them by role, not by preference.
How to Build a Coherent Infrastructure Risk Program
The comparison shows what each framework does. This section shows how to turn them into one working program.
Start with BIA to define critical services and set recovery targets. That step matters because BIA keeps technical scoring from drowning out business impact. In plain English, it tells you what the business can't afford to lose and how fast it needs to recover.
Next, use RMF, CSF, or ISO 27001/27002 to assign controls and ownership. This is where the program moves from what matters most to who owns what. Without that layer, risk work can drift into vague good intentions.
From there, bring in ITIL, FMEA, and SRE error budgets to handle day-to-day reliability and uptime. Think of it as shifting from planning to daily operations. These frameworks help teams manage incidents, spot failure points, and make better calls about service stability before small issues turn into ugly outages.
Then use DR maturity and resilience reviews to test recovery when things go wrong. Controls on paper are one thing. Recovery under failure is another. These reviews show whether teams can meet recovery goals when systems are under stress.
Once controls are in place, track every finding in one register so owners and deadlines stay visible. The core control layer is a centralized risk register. Track:
- Risk ID
- System owner
- Business owner
- Critical service
- Likelihood
- Impact
- RTO
- RPO
- Mitigation owner
- Due date
- Review date
- Residual risk
Update open risks on a fixed cadence so mitigation doesn't stall.
Start with the systems that support critical business processes first. That order keeps governance, operations, and recovery tied to the same critical services instead of pulling in different directions.
Conclusion
The comparison above makes one thing clear: each framework answers a different kind of risk question. No single framework covers infrastructure risk from end to end. If you want a clear view of downtime risk, you need to look at business impact, governance, and technical resilience together.
Keep the process simple. Use this mix of frameworks to rank the services that would cause the most damage if they went down for 24 hours. Then put a dollar figure on that exposure in USD with the ALE formula. After that, fix the highest-risk gaps first.
Reassess the risk profile after major changes, like a cloud migration, a new vendor integration, or major staffing turnover.
The goal is straightforward: fewer surprises, faster recovery, and less downtime.
FAQs
::: faq
Which framework should I start with?
It depends on your regulatory setting, your team’s risk maturity, and what you’re trying to get done.
If you’re a mid-market company starting from scratch, NIST CSF 2.0 is a strong place to begin. If you need ISO 27001 certification, go with ISO 27005.
Need to explain security spending to the board in business terms? FAIR can help frame risk in a way that makes budget talks easier.
If you’re a government contractor, the NIST Risk Management Framework should be at the top of your list. :::
::: faq
How do I choose between BIA, FMEA, and ALE?
Choose based on what you need to decide.
BIA connects IT systems to business processes. It helps teams set recovery targets like RTO, RPO, and maximum tolerable downtime.
FMEA looks at a specific system or application. The goal is to spot and rank technical failure risks.
ALE puts risk into dollar terms by estimating the expected yearly financial loss.
A common approach is simple: use BIA to figure out business priorities, then use FMEA to check how well the supporting infrastructure can hold up. :::
::: faq
How often should infrastructure risk be reassessed?
Conduct a formal IT risk assessment at least once a year. This gives you a clear baseline for your risk posture and helps meet audit requirements.
You should reassess sooner when changes could materially affect risk exposure. That includes:
- Major infrastructure updates
- New third-party integrations
- Security incidents or near misses
- Regulatory changes
- Major business events, such as acquisitions
In fast-changing environments, an annual review on its own usually isn’t enough. A better approach is to pair the yearly assessment with event-driven reassessments. :::